Other articles
- Apple Ads theory: Basic vs Advanced
- Apple Ads theory: Placements
- Apple Ads theory: Campaigns
- Apple Ads theory: Ad Groups
- Apple Ads theory: Target and Negative Keywords
- Apple Ads theory: Search Terms
- Apple Ads theory: Ad Variations
- Apple Ads theory: Impression Share
- Apple Ads practice: Exact Match Campaign
- Apple Ads practice: Bidding
- Apple Ads practice: Discovery Campaign
- Income vs Cohort Income
Cohort Income vs Time Range Income
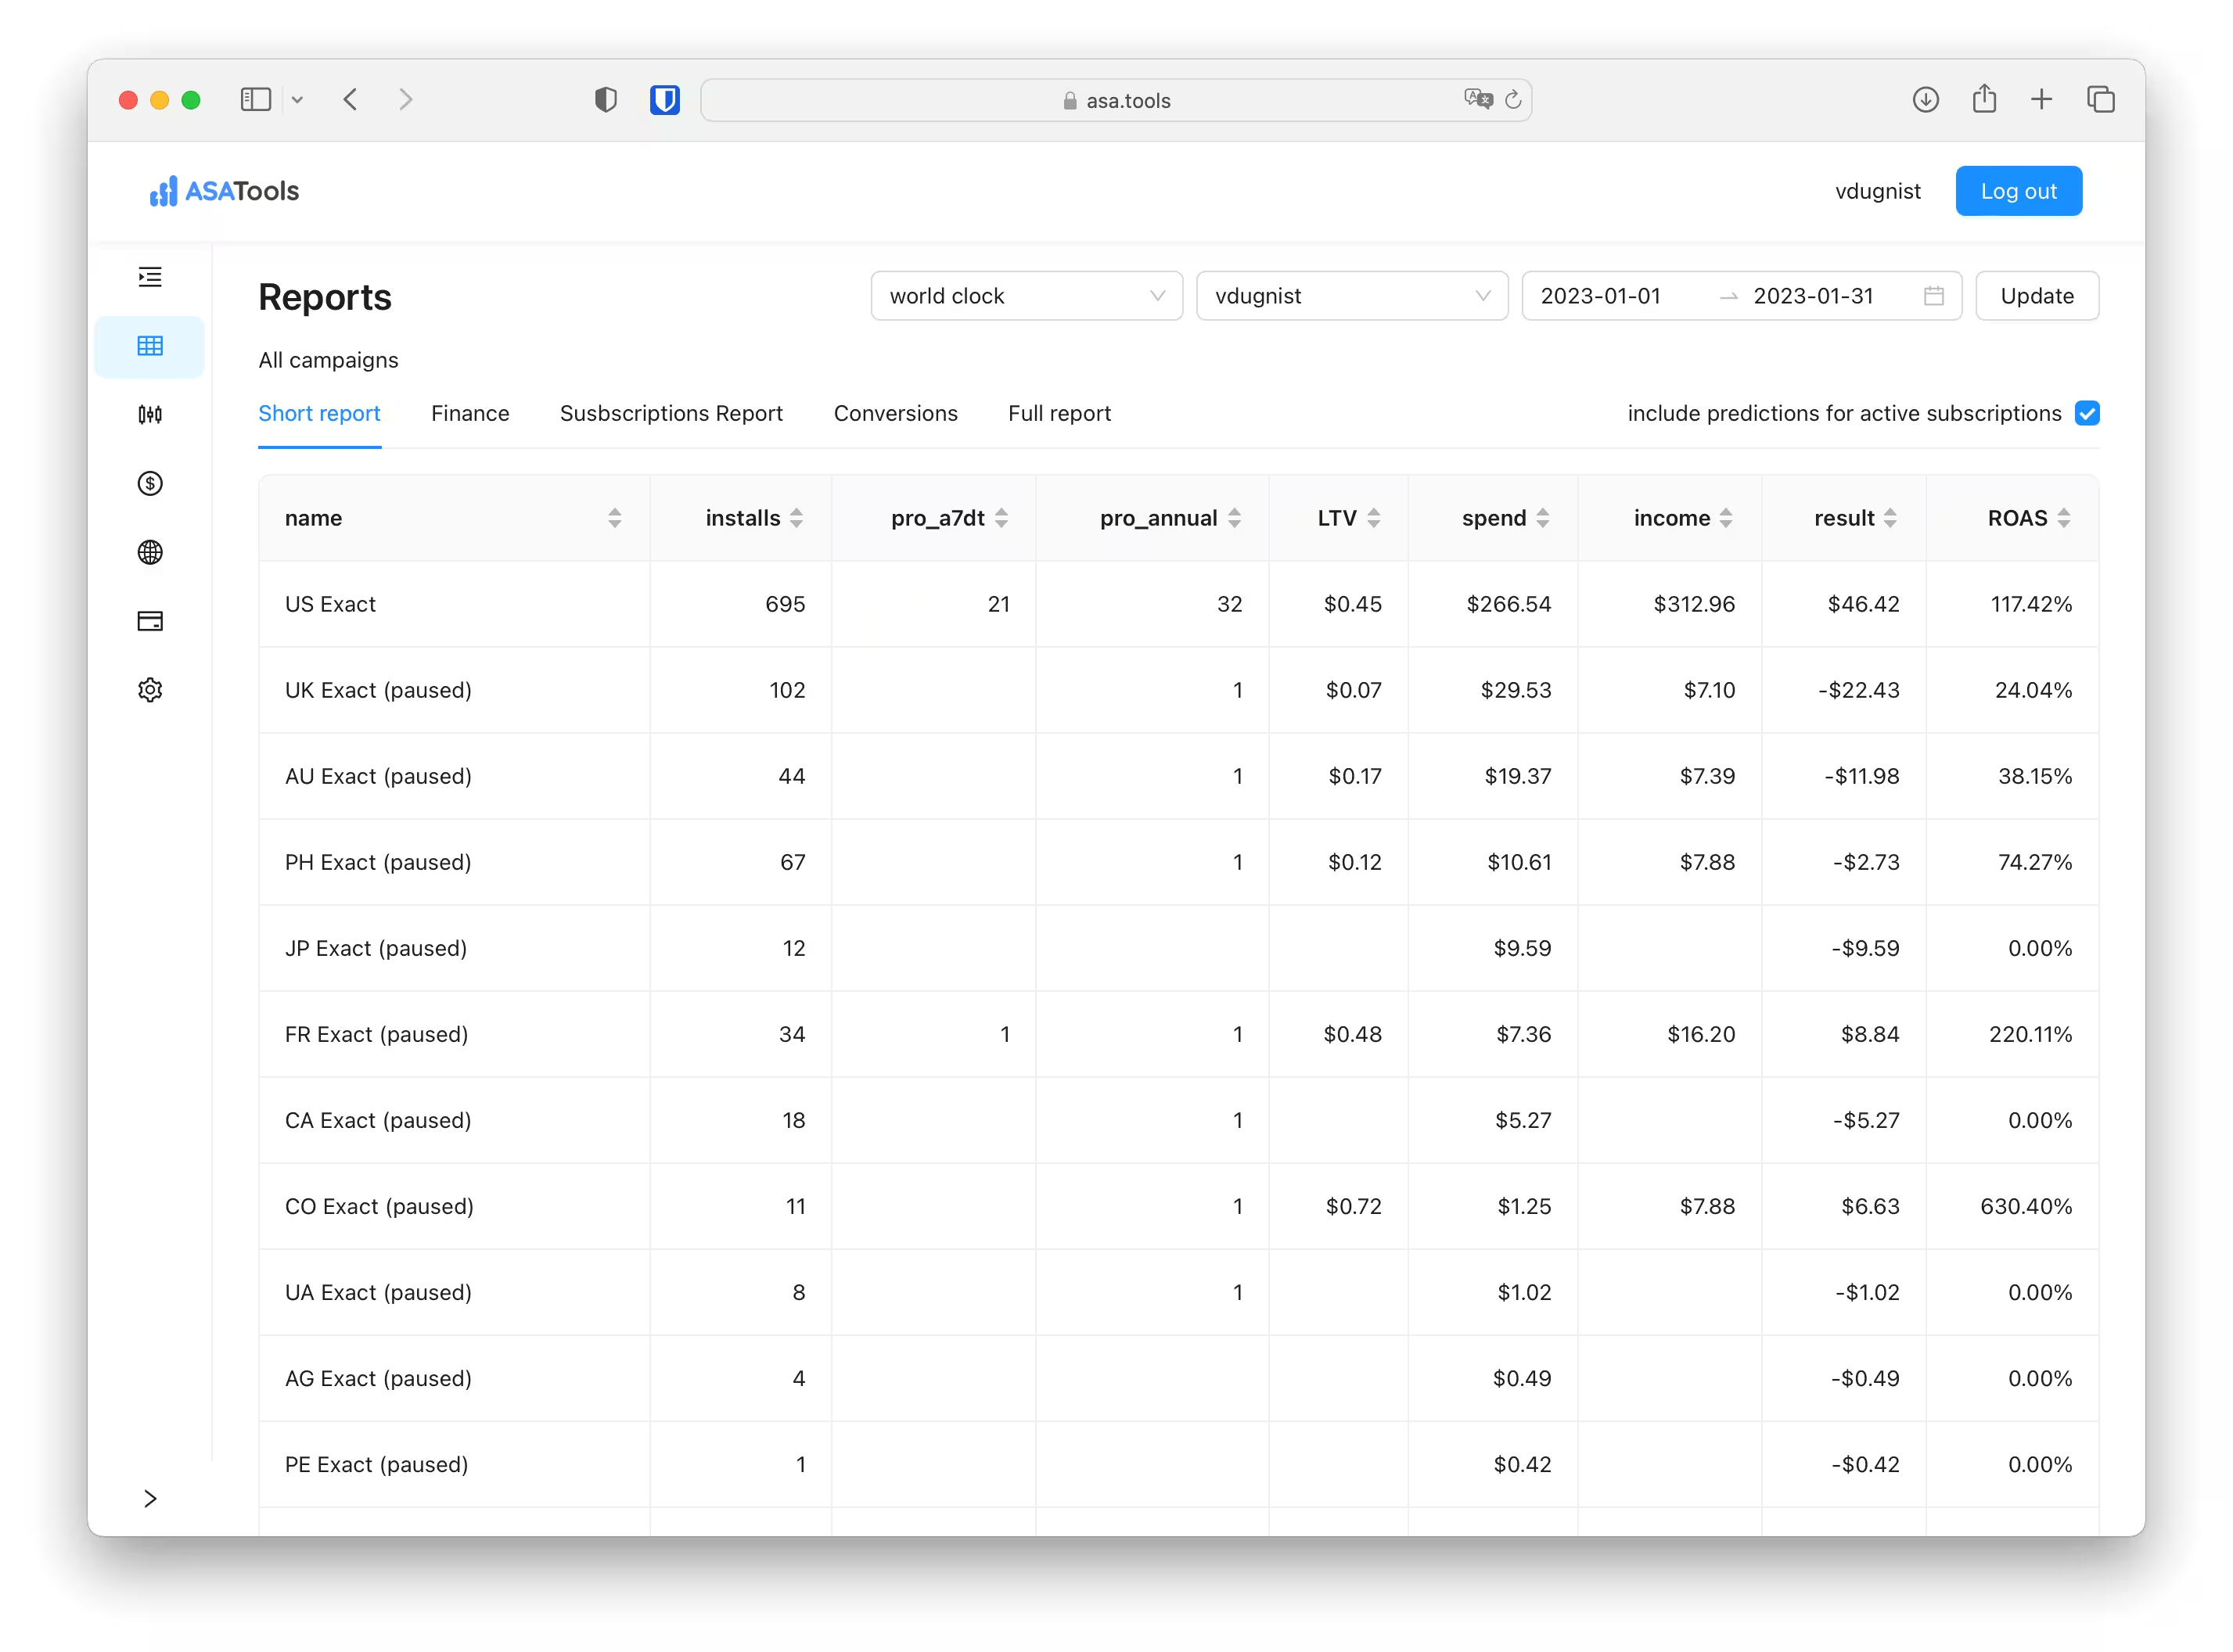
In ASATools, we are showing cohort income in our reports. It means that when you select a time range for a report, we will show all the income for the users who installed the application in the selected time range no matter when they made a purchase.
Let's say it's Aug 7 and you've selected Jan 1 - Jan 31. In the report you will see the income from the users who installed the application from Jan 1 to Jan 31 and made a purchase any time until the day you made a request (Aug 7 in this case). This analysis method allows you to calculate the return on your advertising spend (ROAS).
App Store Connect proceeds report, on the other side, shows time range income. It means that if you will select Jan 1 to Jan 31 in proceeds reports you will see the income from the users who got charged between Jan 1 to Jan 31 no matter when they installed the application.
Total value may be higher, if you have old customers with active subscriptions, who got charged during this period. Or lower, because you don't include charges from customers who installed the app in January but paid later.
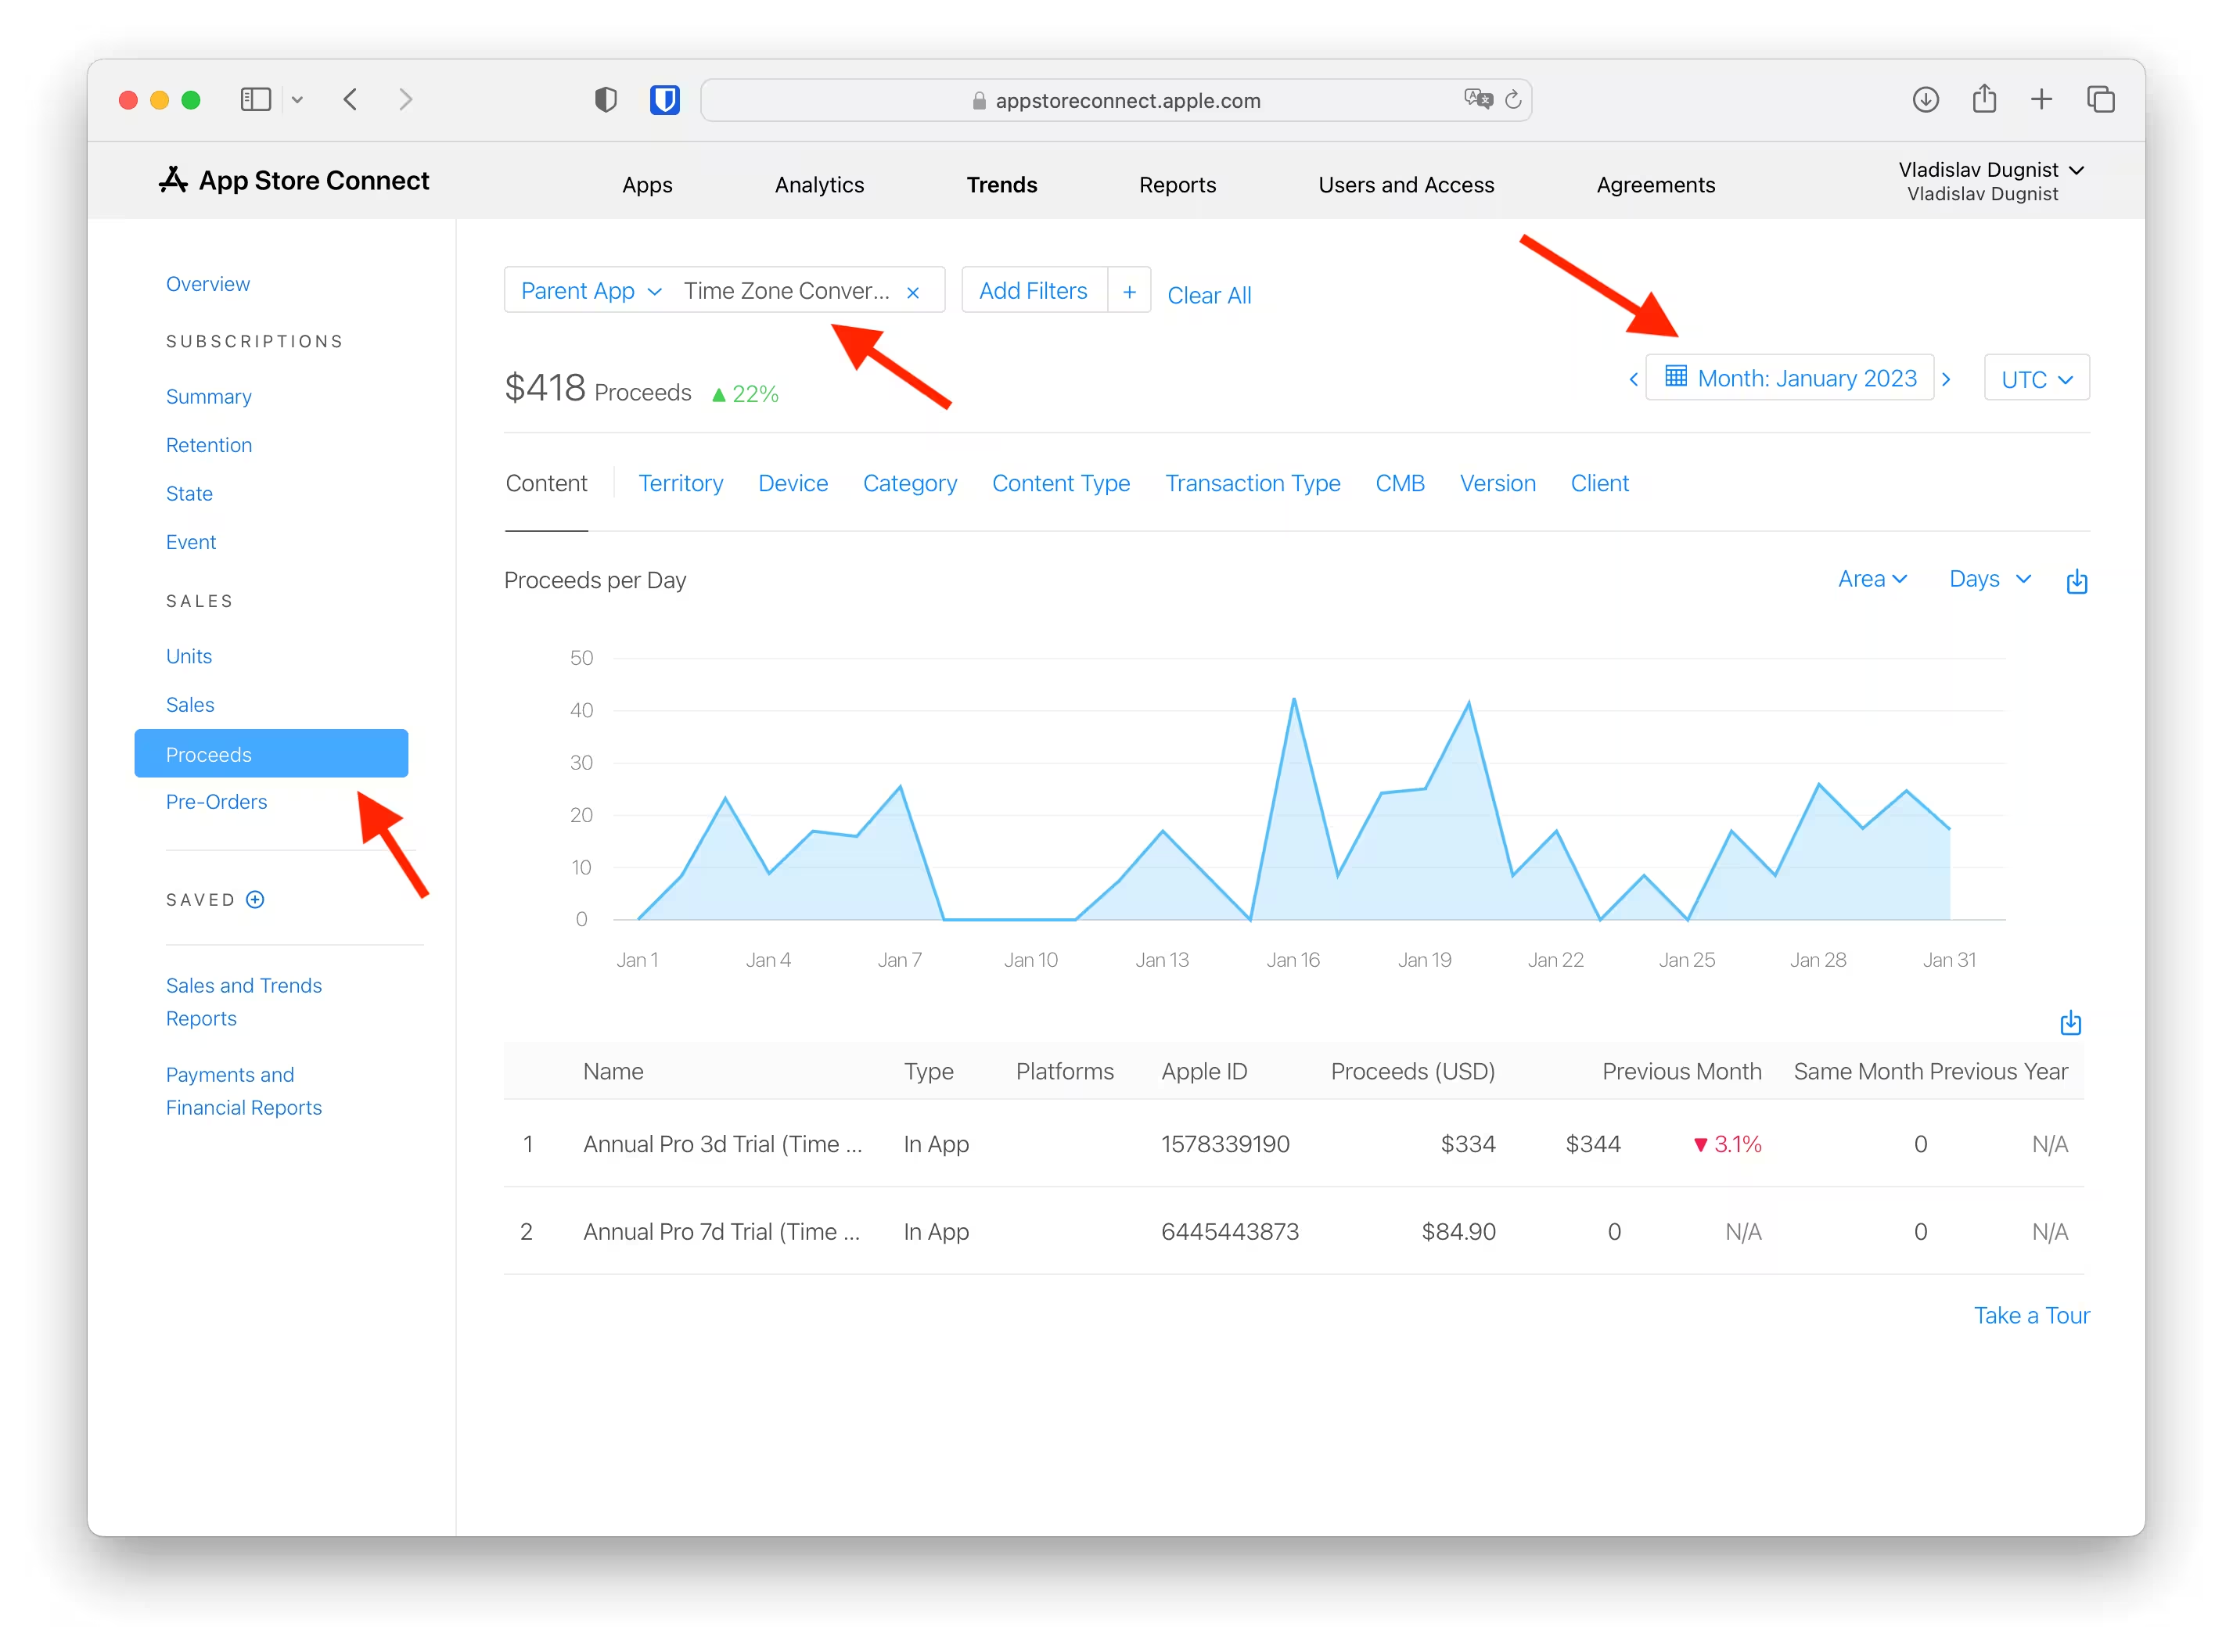
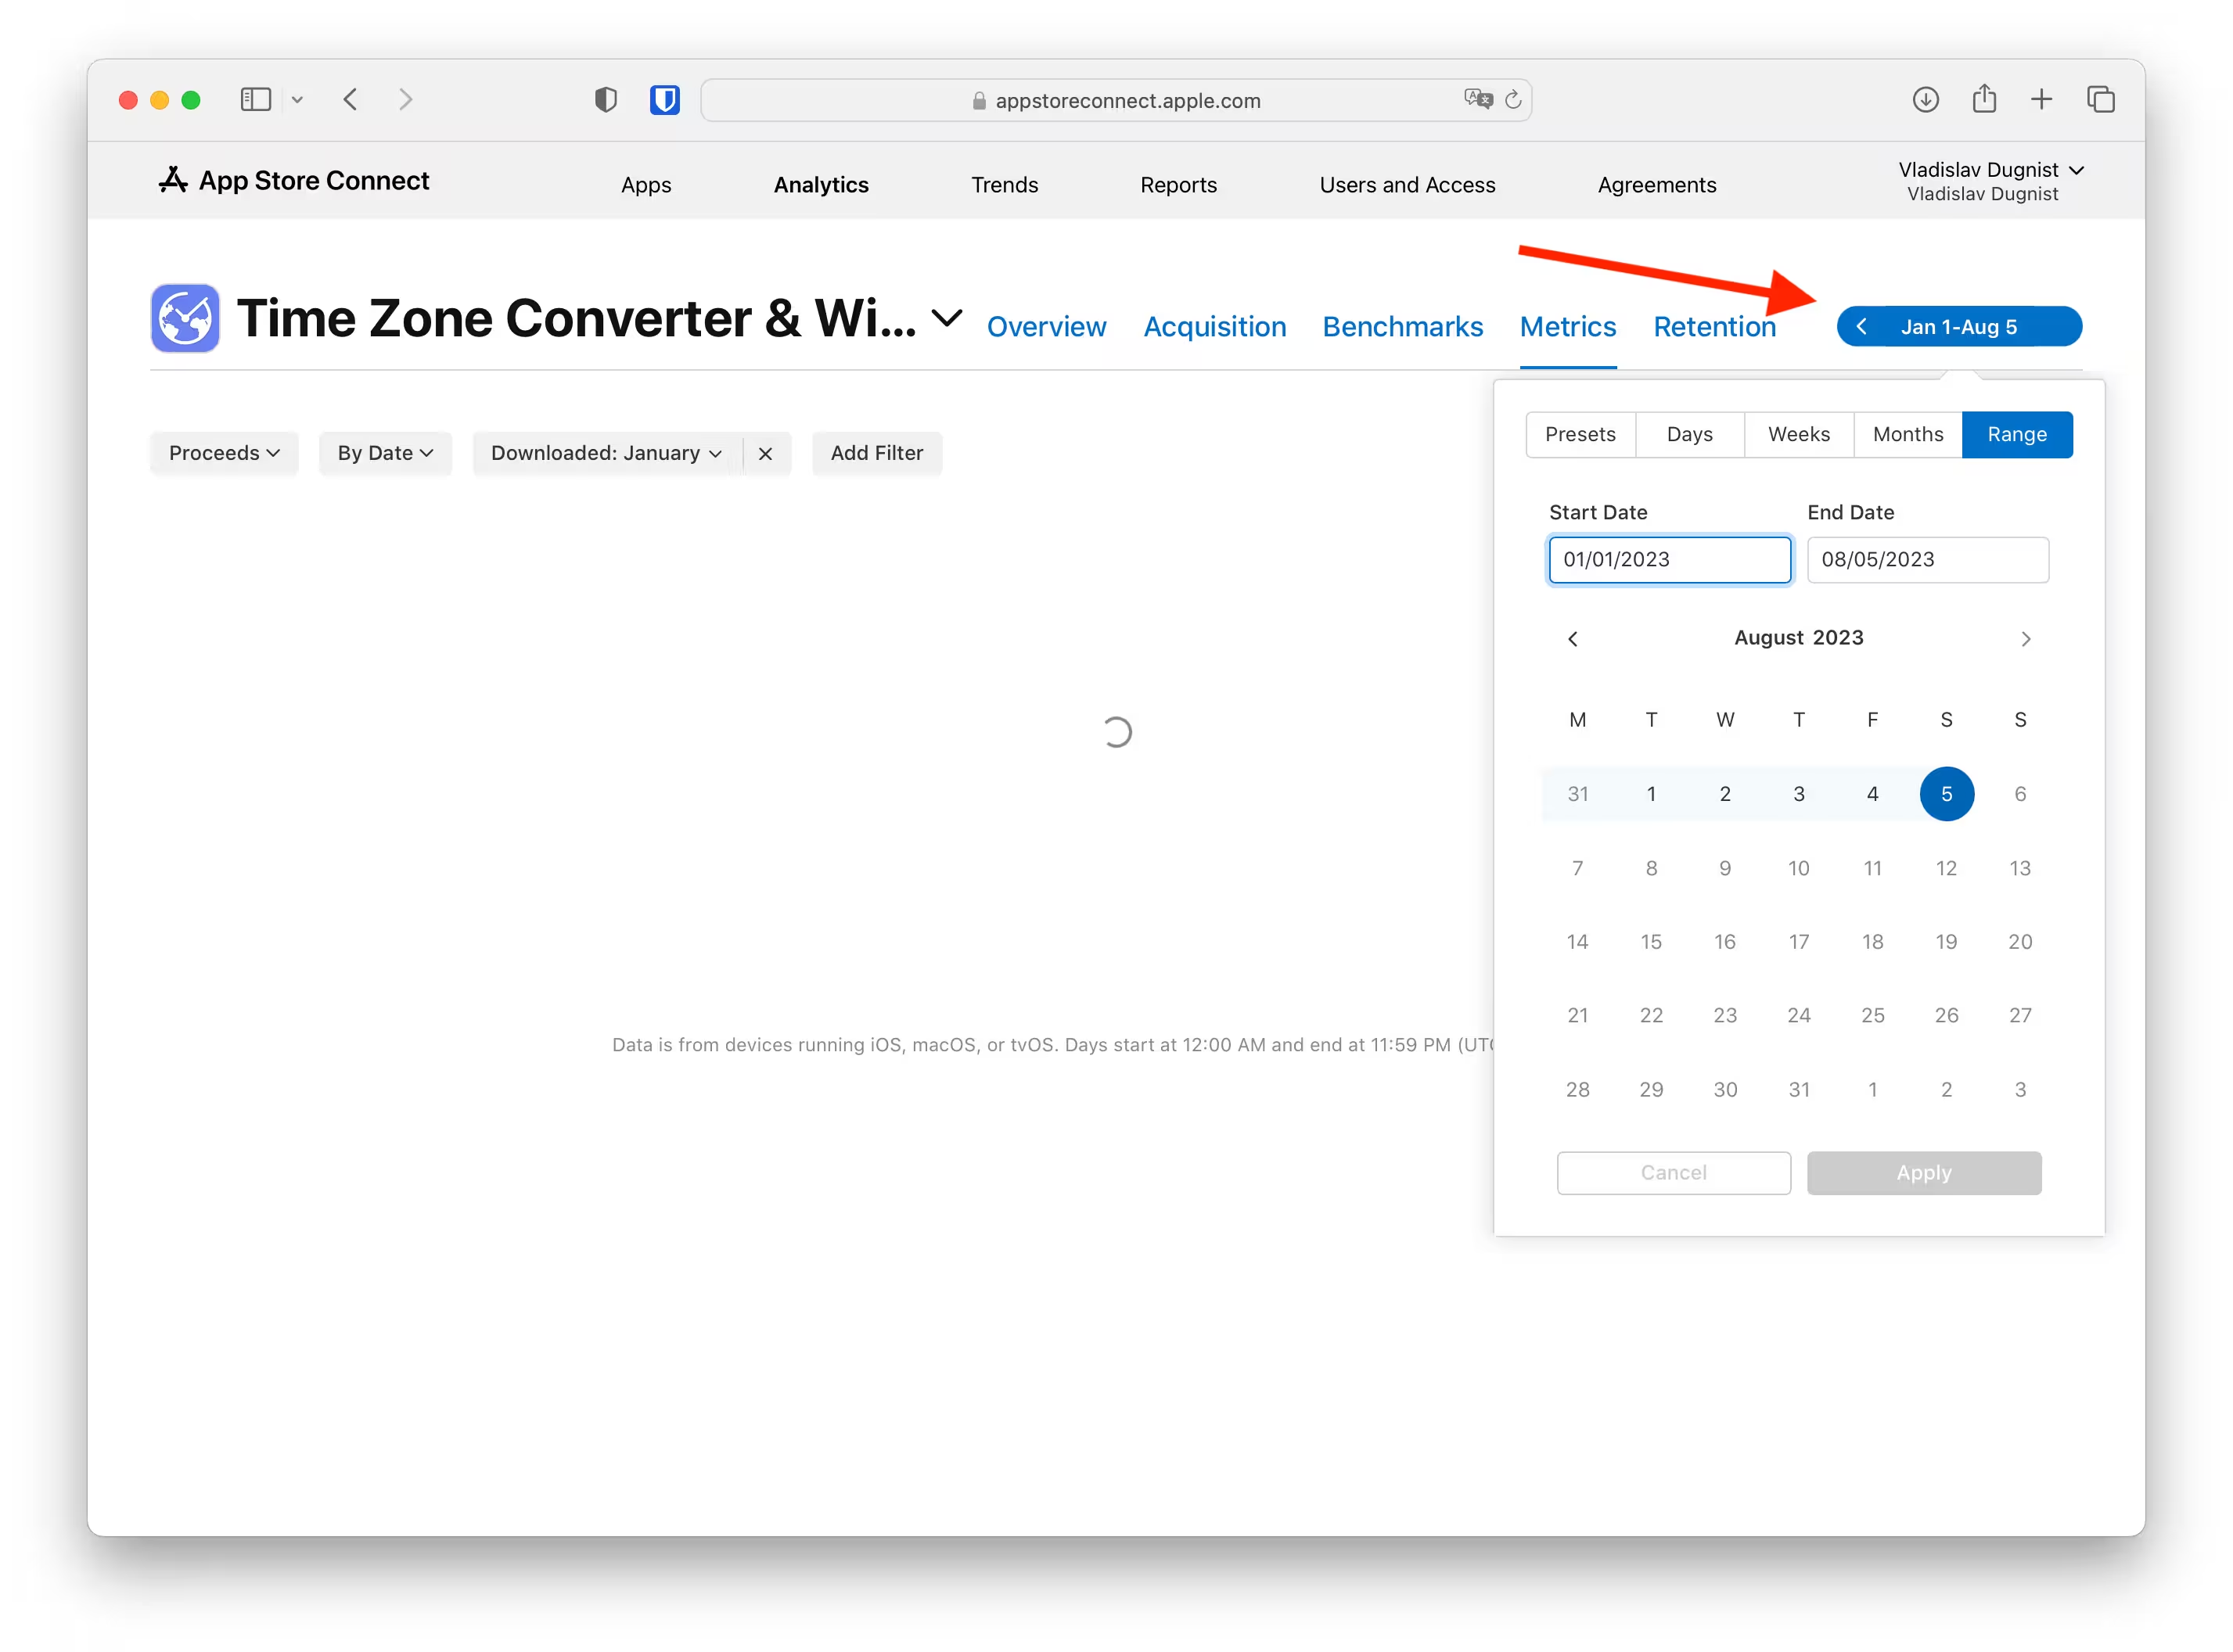
There's also a way to get cohort reports from App Store Connect. To do this, open the Analytics tab, select your application, and click on Proceeds.
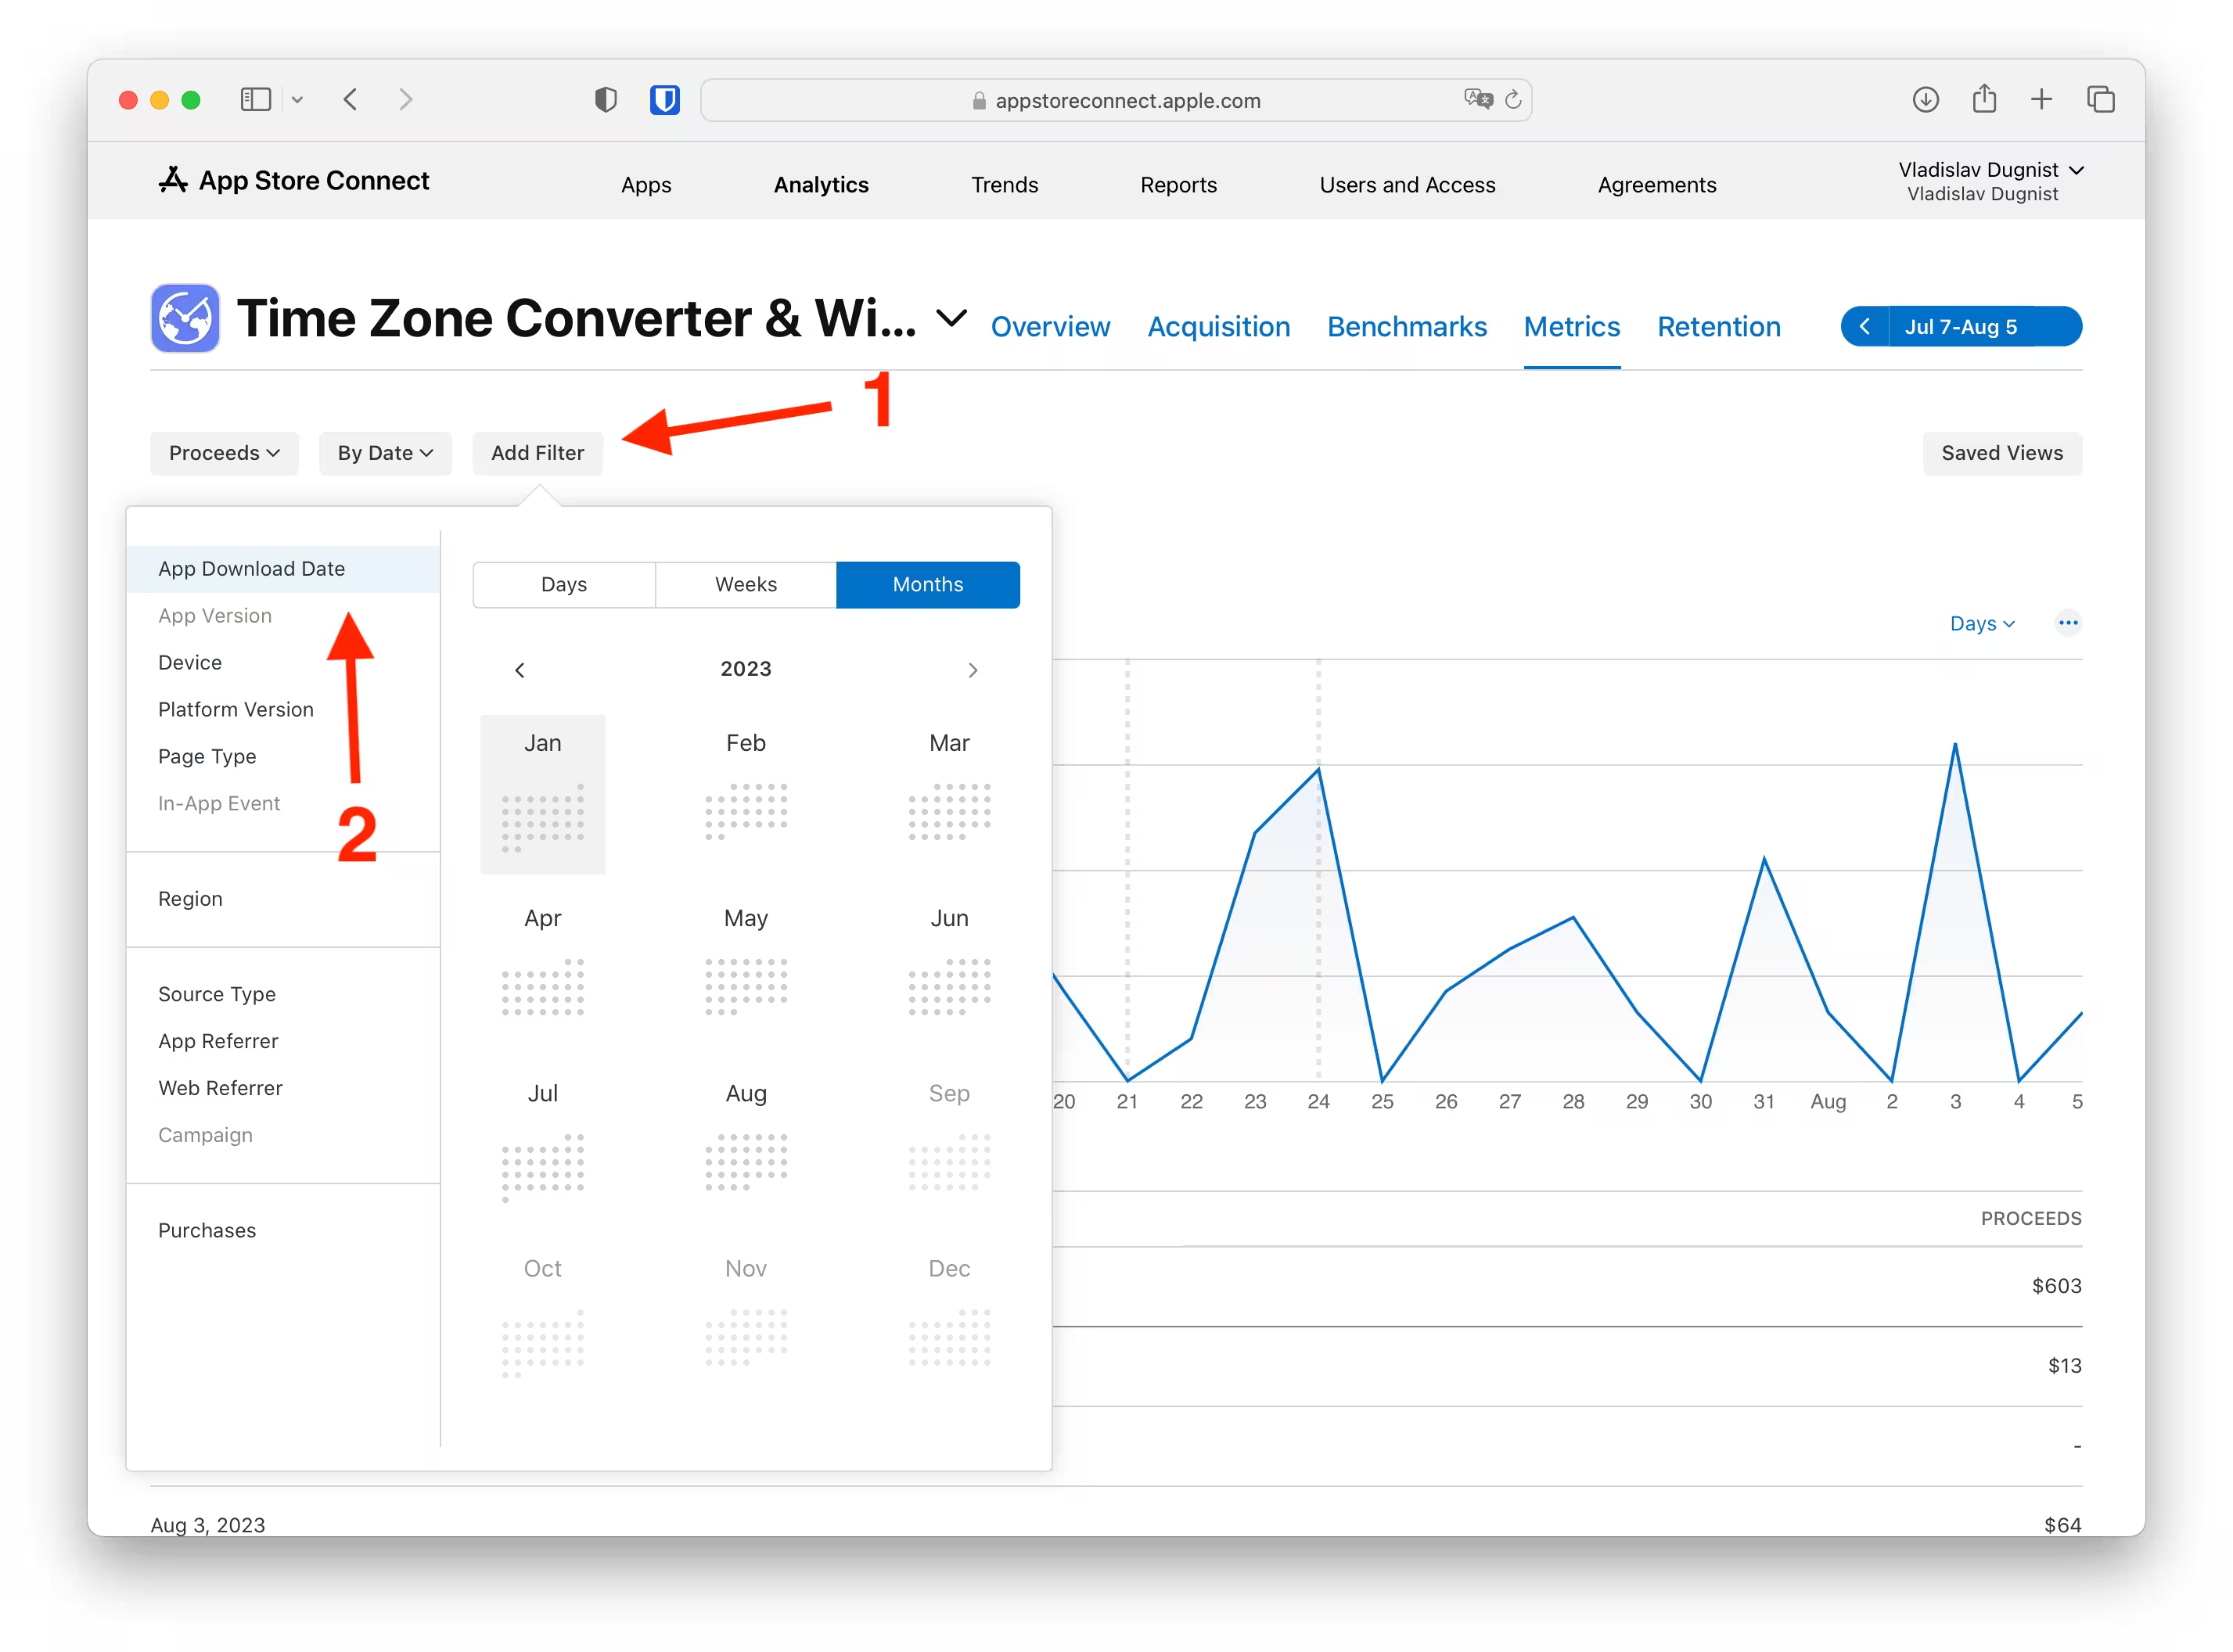
After this, click "Add filter" -> "App Download Date" -> select month that you need.
Now you should select the report time range from the first day of the selected cohort range (Jan 1 in our case) to the last available day (Aug 5 while the article was written on Aug 7).
After these actions, you will see the cohort report for January. You can see on the graph that there were purchases made in February and March from the customers that installed the app in January:
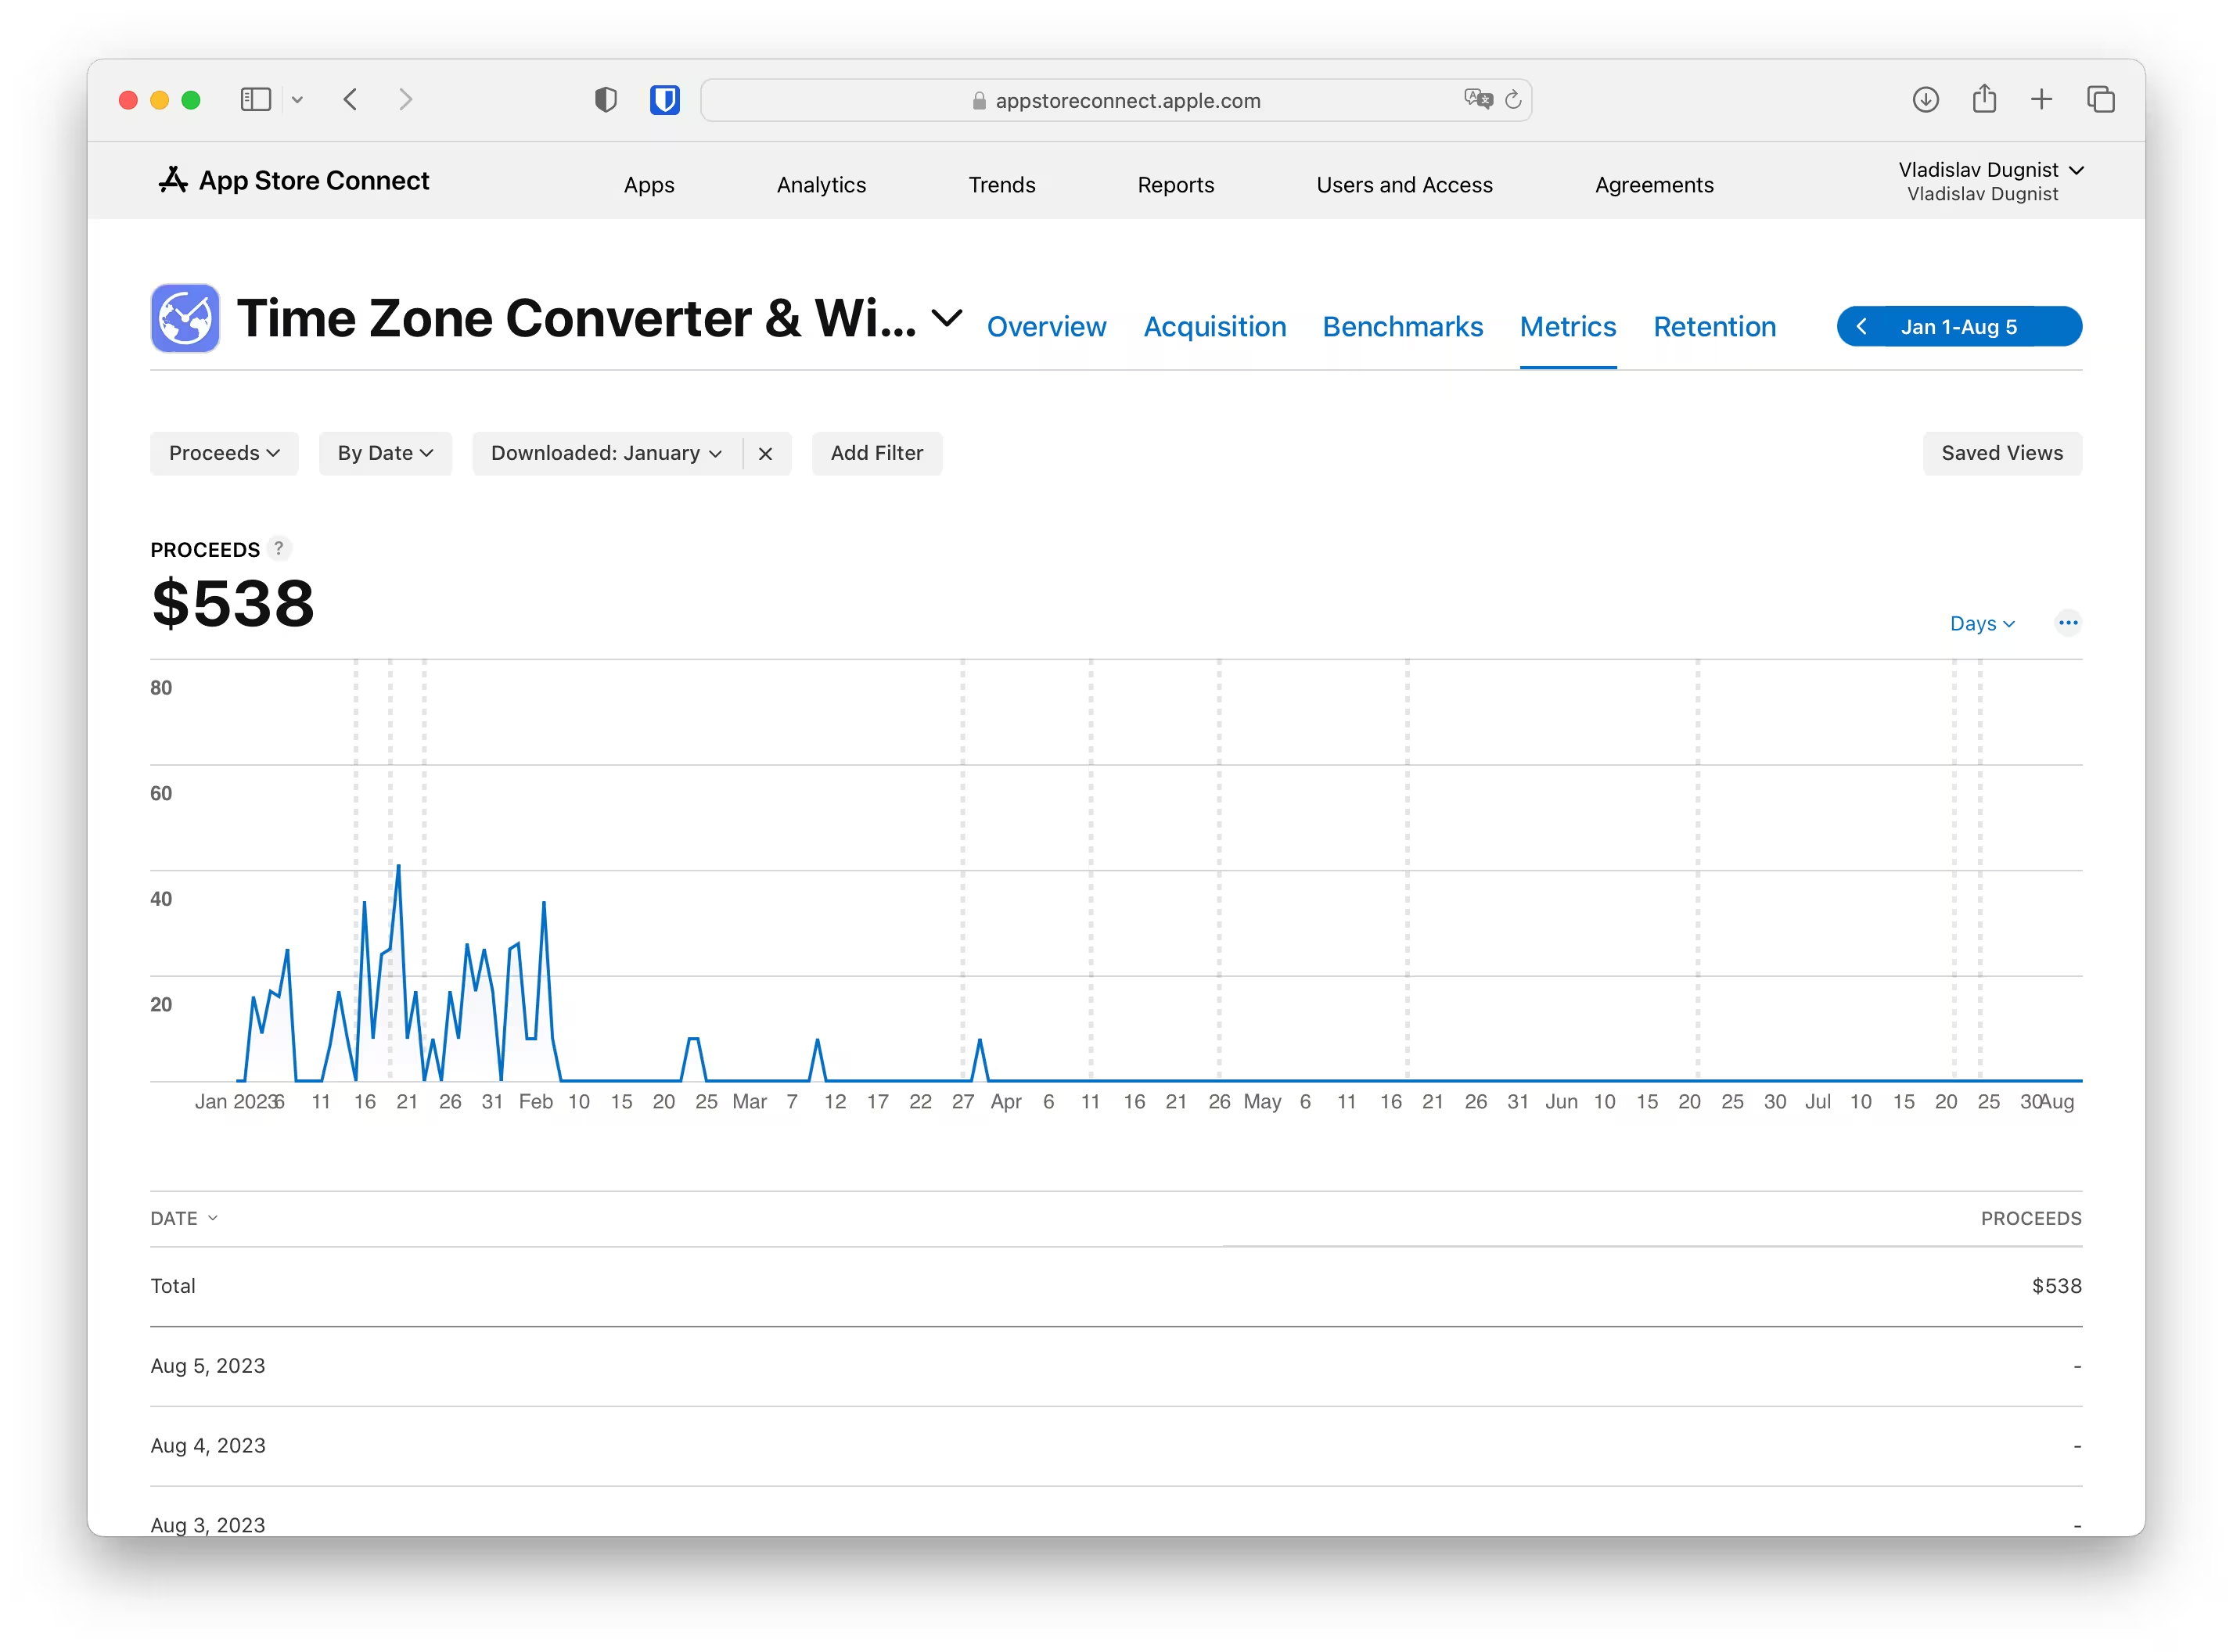
Note that in App Store Connect you can find only total cohort proceeds. If you want to see them by Search Ads campaigns, ad groups, and keywords, you can do it in the ASATools dashboard.